 © Projektträger Jülich / Forschungszentrum Jülich GmbH
Near-surface geothermal energy in the municipal heating transition
Geothermal potential across Germany: Discover your region in just a few clicks
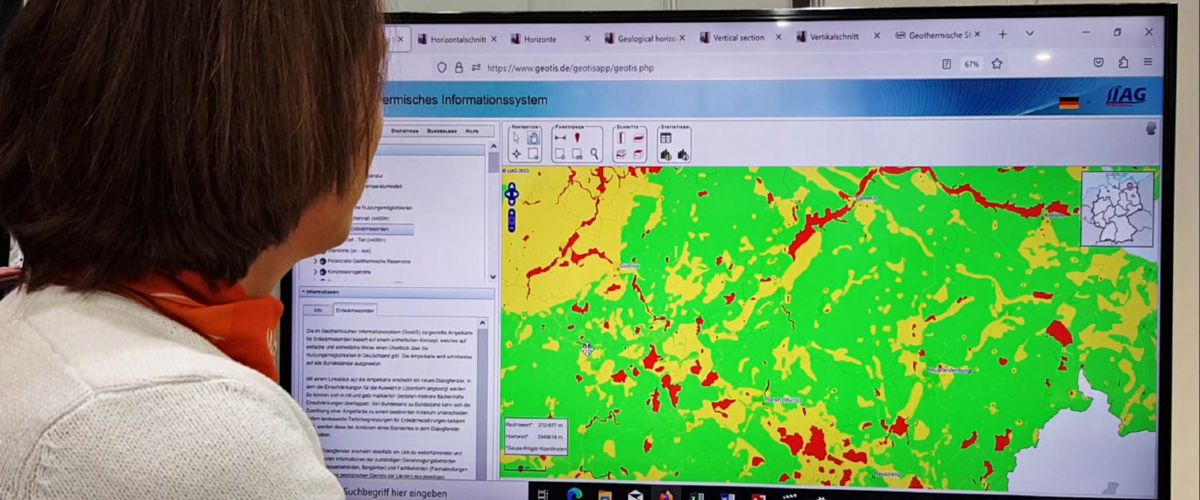
The data for the last of Germany’s federal states has been entered, and the interactive map now covers the entire country. Anyone interested can go online to the GeotIS information portal to check whether their region is suitable for geothermal probes. With this, the WärmeGut project has reached a key milestone.
The map is aimed at anyone considering the use of geothermal energy for their heating supply, whether professional contractors, private homeowners or local authorities. Traffic light colours indicate general suitability. Green means the region is fully suitable for geothermal probes. Red indicates the area is not suitable, for example due to existing groundwater protection. Yellow shows limited suitability, such as where drilling depth must be restricted in advance.
Green and yellow indicate regions suitable for geothermal probes
However, the colour yellow also means that a region is generally well suited for geothermal probes, explains Professor Dr Inga Moeck. She heads the System Integration research division at the LIAG Institute for Applied Geophysics, is a professor at the University of Göttingen, and coordinates the WärmeGut project. “You can compare yellow to a speed reduction in road traffic. It’s there to keep things safe,” says Moeck. “On our traffic light map, yellow means you’re allowed to drill and use geothermal energy with some limitations.” For example, two 50-metre probes could be used instead of a single 100-metre probe. In the end, what matters is the total number of metres drilled.
 © LIAG Institute for Applied Geophysics
The traffic light maps provide an initial guide. Anyone interested will need to discuss the next steps with the relevant authority. The necessary contact details, including links to the authorities, can be found within the map. “We expect this map to draw attention to geothermal energy as a measure within municipal heating planning and to give a significant boost both to the energy transition and to scientific geothermal research,” explains Moeck.
Traffic light map standardises complex data
In the WärmeGut project, researchers worked together with the geological services of all 16 federal states to compile the data for the newly published overview maps. Whether on paper, in Excel spreadsheets, or as digital databases, high-quality data on the feasibility of geothermal energy already existed, but it was held in different formats by the various state geological services. “One of our major hopes for the WärmeGut project was to make these data accessible,” said Dr Sven Rumohr from the Hessian State Office for Nature Conservation, Environment and Geology during the course of the project.
That goal has now been achieved. “Together with our project partners and the state geological services, we have succeeded in developing a digital map that meets both the specific requirements of each federal state and the need for a clear, standardised presentation of complex data,” explains project leader Inga Moeck, describing the project’s challenges. “This represents a historic milestone for geothermal research.”
Using potential maps for municipal heating planning
Looking ahead, the maps could become a useful tool for municipal heating planning. The research team led by Moeck is already working on additional maps that show the potential of different regions for other near-surface geothermal technologies, such as collector and well systems. According to the professor, in the future, there could be potential maps that allow users to calculate how much of their heating demand can be met through near-surface geothermal energy. (mb)